Database Creation and Visualization for a Pest Control Company

Overview
During my time working in sales at a pest control company, I didn’t have the opportunity the opportunity to build a database, as my responsibilities were focused on direct sales. However, after leaving that role, I decided to create a sample project using mock data to illustrate how the business could benefit from adopting modern data practices.
Data Generation
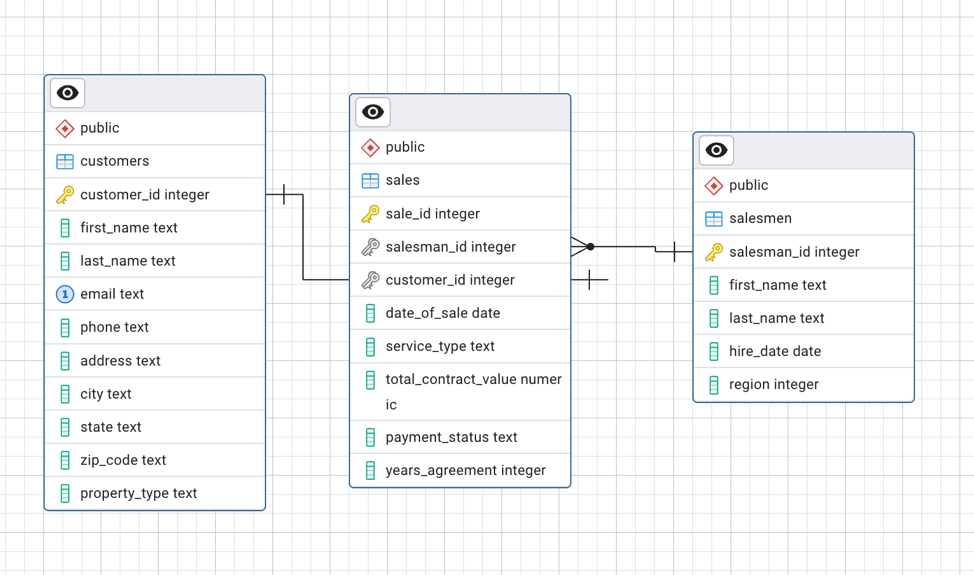
Using Python, I generated synthetic data relevant to the pest control industry. The dataset includes three main tables: Customers, Sales, and Salesmen.
Customers Table
customer_id: Unique identifier for each customerfirst_name: Customer’s first namelast_name: Customer’s last nameemail: Email addressphone: Phone numberaddress: Street addresscity: City of residencestate: State or provincezip_code: Postal or ZIP codeproperty_type: Either “Commercial” or “Residential”
Sales Table
sale_id: Unique ID for each transactionsalesman_id: ID of the salesperson who made the salecustomer_id: Foreign key linking the sale to a customerdate_of_sale: Date of the transactionservice_type: Type of service (“Roach Only”, “Mosquito Treatment”, or “Full Pest Control”)total_contract_value: Dollar value of the contractpayment_status: “Paid”, “Pending”, or “Partial”years_agreement: Duration of the contract in years
Salesmen Table
salesman_id: Unique identifier for each salespersonfirst_name: First name of the salespersonlast_name: Last name of the salespersonhire_date: Date the salesperson was hiredregion: Numeric code representing their geographic area
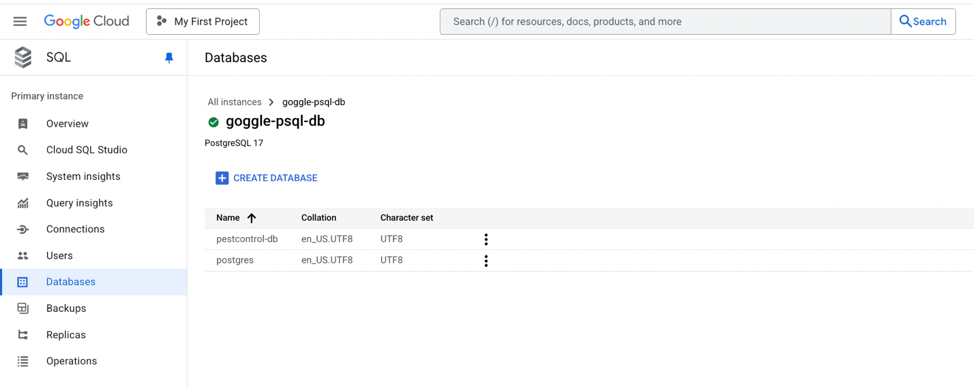
Cloud Database Setup
I chose Google Cloud SQL to host the database—not because of any specific technical requirement, but due to its widespread use alongside AWS and Azure.
The database was implemented in PostgreSQL with the following relationships:
- A one-to-one relationship between the Customers and Sales tables
- A one-to-many relationship between the Salesmen and Sales tables
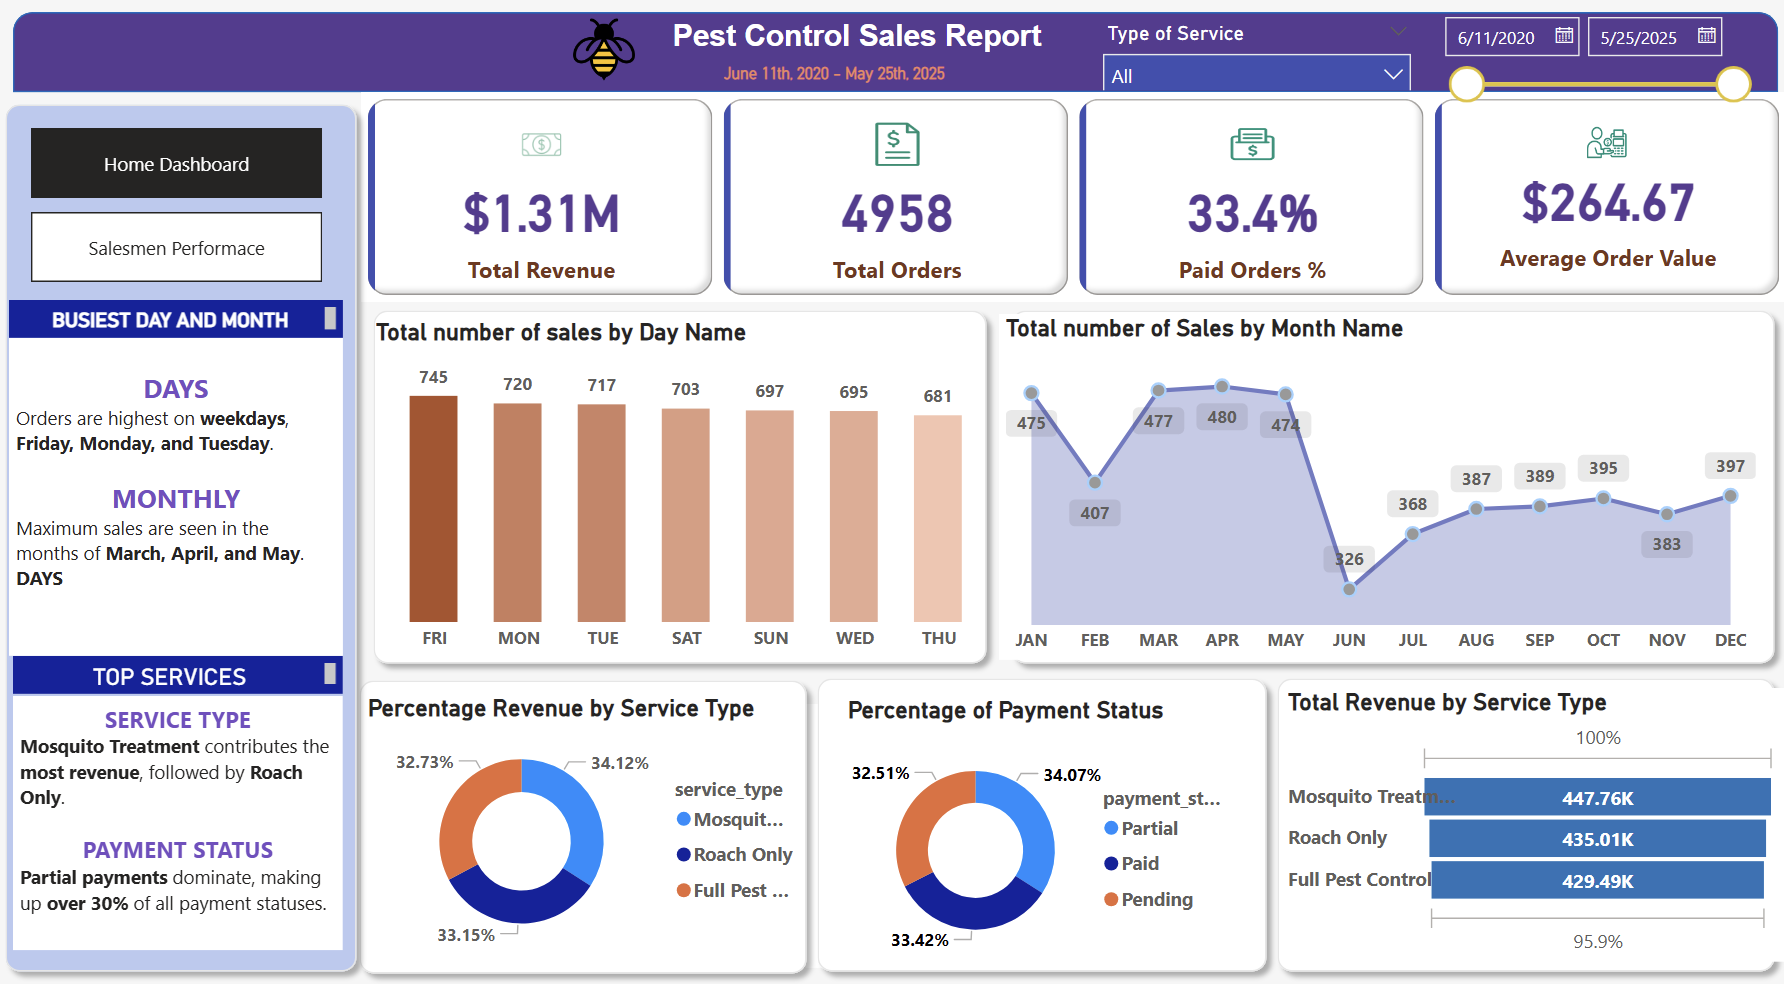
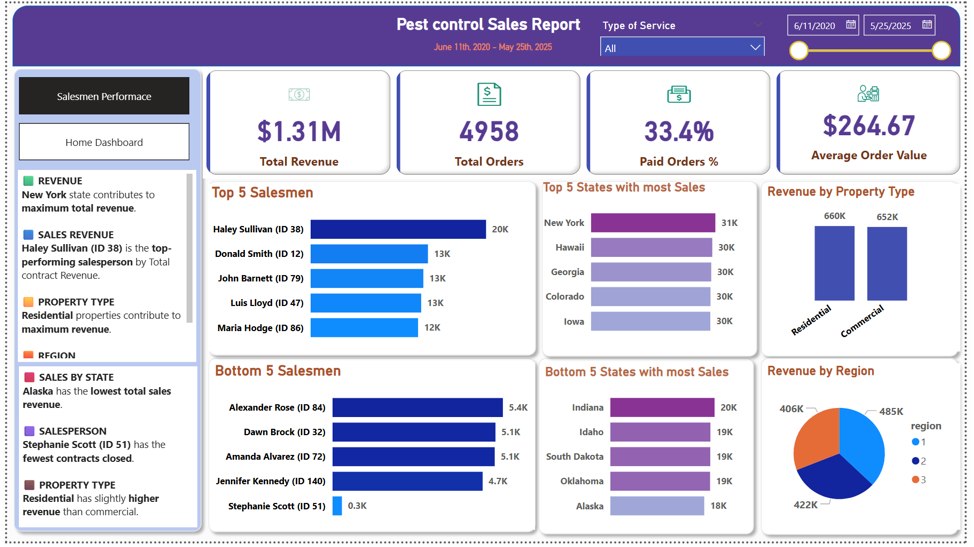
Data Visualization
For the visualization component, I used Power BI to connect directly to the Google Cloud-hosted PostgreSQL database. The dashboard provides visual insights into:
- Sales activity
- Types of pest control services
- Contract values
- Payment statuses
Since the data is randomly generated, the visualizations don’t reveal real business trends. However, this prototype demonstrates how a company could extract valuable insights using real operational data by tracking KPIs and performance metrics.
Conclusion
Even though real-world data was not used, this project simulates the full data pipeline—from database creation to cloud deployment and visualization. It illustrates how a pest control business (or any small-to-medium enterprise) could implement an ETL process and leverage tools like Power BI to improve decision-making through data.